Note
Go to the end to download the full example code.
Line
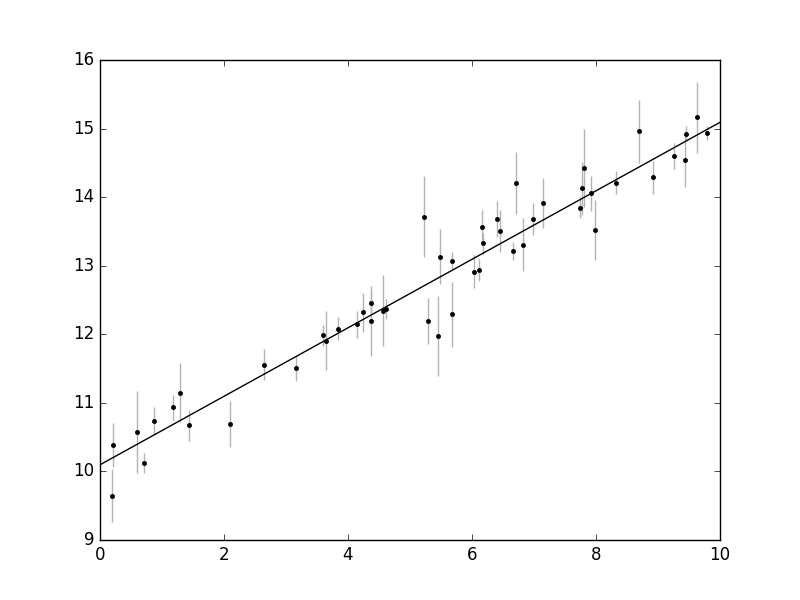
Example of fitting a straight line to some data.
from __future__ import print_function

import numpy as np
import matplotlib.pyplot as plt
import corner

import nestle

np.random.seed(0)

def model(theta, x):
    m, c = theta
    return m*x + c

# Generate some data
theta_true = [0.5, 10.0]
N = 50
x = np.sort(10*np.random.rand(N))
y = model(theta_true, x)
yerr = 0.1+0.5*np.random.rand(N)
y += yerr * np.random.randn(N)


# The likelihood function:
def loglike(theta):
    return -0.5*(np.sum((y-model(theta, x))**2/yerr**2))


# Defines a flat prior in 0 < m < 1, 0 < b < 100:
def prior_transform(theta):
    return np.array([1., 100.]) * theta


# Run nested sampling
res = nestle.sample(loglike, prior_transform, 2, method='single',
                    npoints=1000)
print(res.summary())

# weighted average and covariance:
p, cov = nestle.mean_and_cov(res.samples, res.weights)

print("m = {0:5.2f} +/- {1:5.2f}".format(p[0], np.sqrt(cov[0, 0])))
print("b = {0:5.2f} +/- {1:5.2f}".format(p[1], np.sqrt(cov[1, 1])))

plt.figure()
plt.errorbar(x, y, yerr=yerr, capsize=0, fmt='k.', ecolor='.7')
plt.plot([0., 10.], model(p, np.array([0., 10.])), c='k')
plt.show()
niter: 11556
ncall: 19613
nsamples: 12556
logz: -35.894 +/-  0.098
h:  9.690
m =  0.50 +/-  0.01
b = 10.10 +/-  0.07
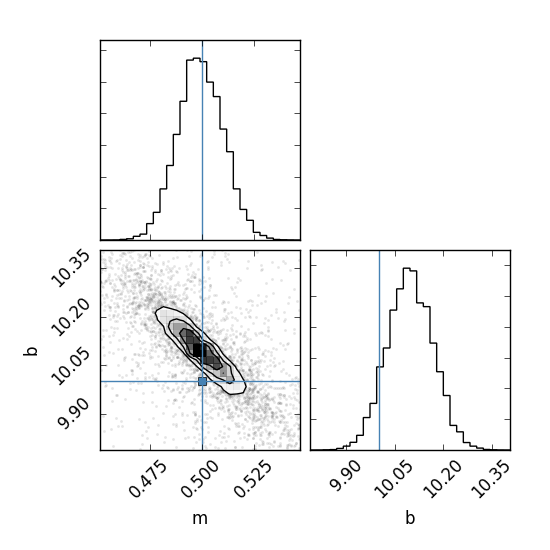
Plot samples to see the full posterior surface.
fig = corner.corner(res.samples, weights=res.weights, labels=['m', 'b'],
                    range=[0.99999, 0.99999], truths=theta_true, bins=30)
plt.show()
Total running time of the script: (0 minutes 0.304 seconds)